In “Measuring Stability: The Missing Metric in Global NCD Health Reform”, the central argument was that chronic disease reform lacks a structural metric. Health systems measure mortality, service coverage, and utilization, yet they rarely assess whether the distribution of population risk is becoming more stable or progressively concentrating at higher-severity states.
The NCD Stability Pyramid translates this conceptual gap into a structured model.
While the modeled distribution aligns with cost concentration patterns observed in NCD-dominant systems, tier proportions and fiscal gradients may differ across settings depending on demographic structure, epidemiologic profile (including infectious disease burden), health financing architecture, delivery system integration, and social determinants of health.
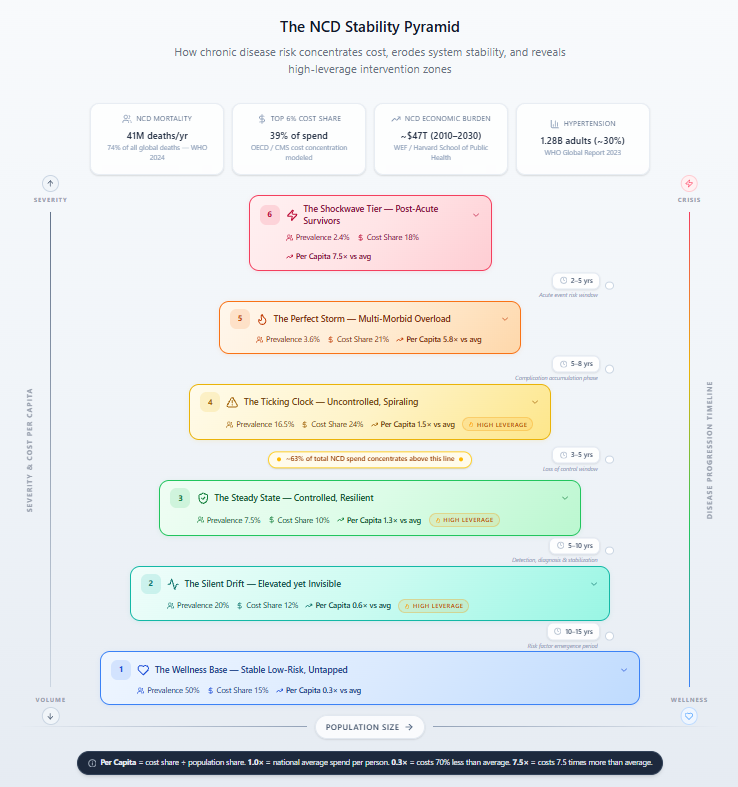
Rather than categorizing disease by diagnosis alone, the Pyramid organizes the population along a severity gradient from stable, low-risk individuals at the base to post-acute survivors at the apex. Each tier reflects increasing clinical complexity, rising per-capita cost intensity, and greater fiscal concentration.
The model highlights three structural dynamics:
- Risk accumulates upward rather than distributing evenly across the population.
- Costs scale nonlinearly, concentrating disproportionately in higher-severity tiers.
- System stability is determined by the balance of transitions between tiers.
In the modeled distribution, the top 6% of the population accounts for 39% of NCD spending. Nearly two-thirds of total NCD expenditure occurs in the upper three tiers. Per-capita costs in the post-acute cohort are approximately 7.5 times the system average. Even modest expansion of high-severity cohorts materially increases total expenditure.
These findings shift the policy focus from episodic care delivery to managing progression and stabilizing risk migration.
The Pyramid provides a structural map of risk accumulation and fiscal concentration. The next step is quantification. A Public Health Stability Index* would operationalize this framework by measuring population distribution across tiers, tracking migration rates between tiers, calculating fiscal concentration ratios, and monitoring per-capita cost multipliers over time. Critically, it would assess net stability movement, whether downward stabilization exceeds upward deterioration, or whether risk is progressively concentrating at the top of the gradient.
Measuring transition dynamics, rather than static prevalence alone, allows health systems to evaluate whether they are structurally stabilizing or becoming fiscally more fragile.
Sources and Methodology Notes:
- WHO Global Report on Hypertension, 2023 -~1.28 billion adults (~30% prevalence); ~20–25% control rates.
- WHO NCD Fact Sheet, 2024 -NCDs kill 41 million people each year, 74% of all deaths globally.
- OECD Health at a Glance; CMS (U.S.) MEPS data; CIHI (Canada) – top 5% of patients account for 40–50% of spending; top 10% for 60–70%.
- NCD Risk Factor Collaboration – hypertension prevalence (controlled, uncontrolled, multi-morbid, post-event).
- World Economic Forum / Harvard School of Public Health, 2011 – NCDs projected to cost the global economy ~$47 trillion from 2010–2030.
Cost share point estimates (15% + 12% + 10% + 24% + 21% + 18% = 100%) are modeled from OECD cost concentration literature across high- and middle-income systems, calibrated so the top 6% of adults (Tiers 5–6) account for 39% of spending consistent with OECD findings that the top 5–10% drive 40–70% of expenditure. Per-capita multipliers are the ratio of each tier’s cost share to its population share. Exact figures require country-specific claims data.
* A proposed metric intended to quantify system stability by measuring risk distribution, migration velocity, and cost concentration across population health tiers.


