

Every organization generates more potential than it converts. AI didn’t create that gap; it just made it too large to ignore
Organizations do not compete on opportunity generation anymore. They compete on opportunity conversion. Competitive advantage is sustained conversion superiority.
Every organization sits on more potential than it will ever capture. It has more use cases than it will fund, more funded initiatives than it will finish, and more finished initiatives than it will turn into measurable outcomes. Value isn’t created in a moment. It is converted through a chain, one decision at a time, and organizations that master that conversion realize more of the value they pursue than organizations that simply generate more of it. That gap between what’s possible and what’s realized has always existed. AI is just what’s making it too large to ignore, and that’s where this theory picks up.
This isn’t a rival to existing theories like dynamic capabilities or absorptive capacity, which explain why some organizations are better at spotting and grabbing opportunities in the first place. This theory starts later. It assumes an opportunity has already been spotted and asks what happens to it next, gate by gate, on the way to a measurable outcome. Those theories describe a capability an organization has. This theory’s core metric, the Value Realization Rate (VRR, defined below), gives the same idea a number you can track.
This article owes a debt to Benefits Realization Management, the two-decade-old field built specifically around the gap between expected and realized value from IT investments (Ward, Daniel, and Peppard’s work is the reference point here). What this theory adds to that lineage is generalizing the problem beyond IT to any organizational opportunity, formalizing the gate-by-gate Chain as a multiplicative rate, and arguing that AI changes the shape of the problem rather than just its severity.
The Value Realization Chain
Every opportunity clears five progressively harder questions on its way to realized value: does it exist at all (Potential)? Is it worth pursuing (Assessed)? Will resources be committed (Committed)? Can it be operationalized (Activated)? Did it produce a measurable outcome (Realized)? Each boundary marks a different decision-maker and a different way to fail. Assessed is an analytical judgment, Committed is a resource decision, Activated is an operational fact, and Realized is an outcome. Collapsing any two erases a real, common failure mode: initiatives that get funded and staffed but never change how work is done, or that activate successfully and never produce the outcome they were funded for.
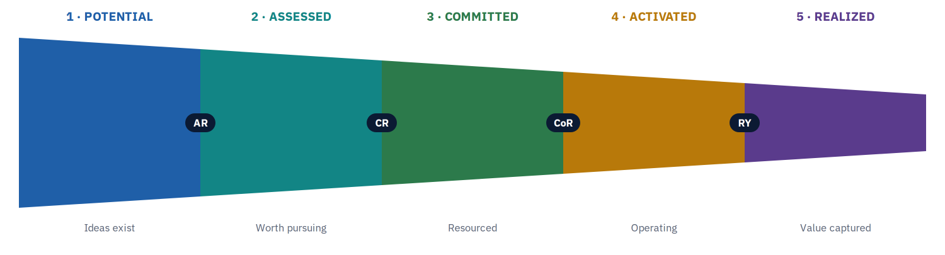
The chain narrows left to right. Each gate is the rate at which value survives into the next stage, named below. These are illustrative proportions, not drawn from any specific organization’s data.
The rate of movement between each pair of stages has a name: the Assessment Rate (AR), Commitment Rate (CR), Activation Rate (CoR), and Realization Yield (RY). Together they define the Value Realization Rate:
| VRR = AR × CR × CoR × RY = Realized Value ÷ Potential Value A single number for how far, on average, an opportunity travels down the chain. |
This equation carries two different meanings depending on when you compute it. Looking backward, once Realized and Potential Value are both known, VRR is an accounting identity. The four rates telescope into the ratio by construction, the same way margin is revenue minus cost over revenue. Looking forward, before an opportunity’s outcome is known, AR, CR, CoR, and RY are estimated probabilities, not fixed multipliers, and VRR becomes an expectation: E[Realized Value] = Potential Value × E[VRR]. The worked example below uses this forward-looking sense. The numbers are forecasts for individual initiatives, not results already booked.
Defining Potential Value. Potential Value is inherently counterfactual. No organization directly observes what an opportunity could have produced. For VRR to function as a real measurement rather than a rhetorical ratio, Potential Value needs an operational anchor: the risk-adjusted, time-bounded economic value an opportunity could reasonably generate under successful execution, estimated at the point of initial assessment and fixed from there. Fixing the estimate at that gate, before Committed, Activated, or Realized outcomes are known, is what keeps VRR from being redefined backward to flatter a result. That doesn’t, by itself, solve the harder problem: two organizations with identical actual performance can still produce very different VRRs if one is simply more optimistic in its initial business case. Comparing VRR across organizations therefore requires comparable estimation discipline: a shared method, external benchmarking, or a periodic audit of initial estimates against realized outcomes, not just a shared formula. Tracking VRR within a single organization over time is less exposed to this problem, since the same estimation bias tends to repeat across periods.
What Determines Movement Through the Chain: F.A.C.T
Two organizations facing the same opportunity end up with very different VRR because of four conditions: Focus (fewer, better bets), Alignment (decisions and incentives that reinforce each other), Capability (the skills, tools, and data to execute; AI can supply real Capability here, but only here), and Tenacity (sustaining effort through friction). In practice, F.A.C.T is the difference between an organization that announces an AI pilot and one that actually changes how a team works. The pilot with no Focus competes with a dozen others for the same attention. The one with no Alignment gets built by engineering and ignored by the frontline team who’d have to use it. Both stall regardless of how good the underlying model is. Each condition maps to something distinct that can stall conversion: attention, decision rights, means, and duration. And each primarily lifts adjacent stage rates. A single investment in one lever tends to move several rates for the same opportunity at once, which turns out to matter a lot (see Conversion Coherence, below). Culture and risk appetite are the two candidates that resist folding cleanly into these four. The working answer is that both act as a multiplier on the other four rather than a fifth lever in their own right. A risk-averse culture doesn’t block Focus, Alignment, Capability, or Tenacity directly; it raises the bar each one has to clear before it moves the conversion rate. Until that interaction is tested empirically, the safer claim is the narrower one: F.A.C.T is necessary, not yet proven exhaustively.
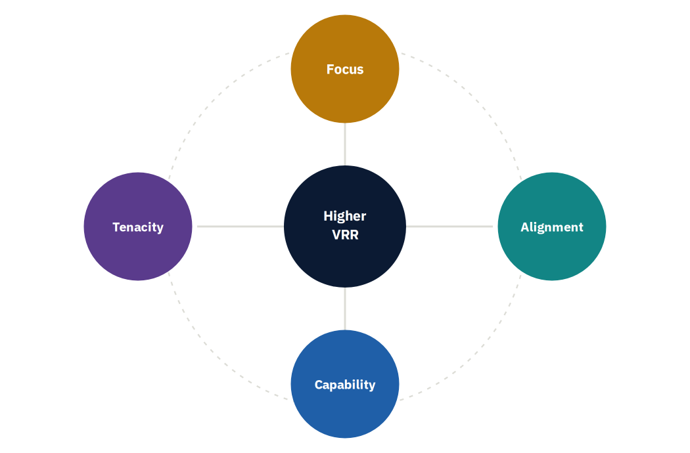
FACT’s four conditions act simultaneously on the same conversion process, not in sequence.
Why AI, Specifically: The Potential Value Shock
The Chain, VRR, and F.A.C.T are domain-general. AI is this theory’s motivating case, not its identity. Potential is the one stage in the Chain with no organizational gate: it only requires an idea to exist. AI sharply lowers the cost of producing exactly that, at near-zero marginal cost, across nearly every function at once. Assessed, Committed, Activated, and Realized are each defined by a human decision-maker crossing a gate. AI can inform that decision but can’t substitute for it, so conversion rates move at the pace of organizational gates, not the pace of idea generation. That’s a structural asymmetry, not a fact about current AI maturity. It follows from how the stages are defined. It’s also what makes AI different from ERP, CRM, or cloud, which mainly improved the gated stages rather than exploding the ungated one.
Before AI, this gap grew slowly, because Potential Value itself was expensive to produce. A new use case took an analyst’s time, a market study, or a strategy offsite, so organizations generated Potential at roughly the pace they could evaluate it. ERP, CRM, and cloud worked on the other side of that balance. They mostly streamlined Committed and Activated, so more of what got proposed actually shipped, without changing how fast new ideas showed up in the first place. AI breaks the old coupling on the Potential side instead. A handful of people with a language model can generate hundreds of plausible use cases in an afternoon, at near-zero marginal cost, in every function at once. Nothing about that changes how fast an organization can staff a business case, get executive sign-off, or retrain a workforce. Those steps still run at the same human pace they always have. So VRR itself, the rate, doesn’t necessarily get worse. Organizations that get good at using AI for real Capability may even improve it. What changes is the scale of what that rate is being applied to. The same 15% conversion rate against 10 times more Potential Value produces 10 times more absolute value left on the table, even while the percentage looks unchanged or improving.
Three practical consequences follow. First, a flood of AI-generated Potential doesn’t speed up decisions. It can slow them down, by competing for the same finite pool of executive attention and vetting capacity at the Assessed and Committed gates, producing longer queues and rushed judgment calls rather than faster throughput. Second, a stable or even improving VRR can hide a growing absolute problem. A dashboard reporting that the conversion rate held steady this quarter looks reassuring right up until someone totals up how much identified opportunity is sitting unconverted behind it. Third, the scarce resource has moved. Before AI, the bottleneck was generating enough good ideas. Now it’s organizational decision capacity: staffing to assess them, governance to commit resources, and change management to actually activate them. Investing further in AI tools that generate still more Potential, without a matching investment in the gates that convert it, doesn’t close the Value Realization Gap below. It widens it.
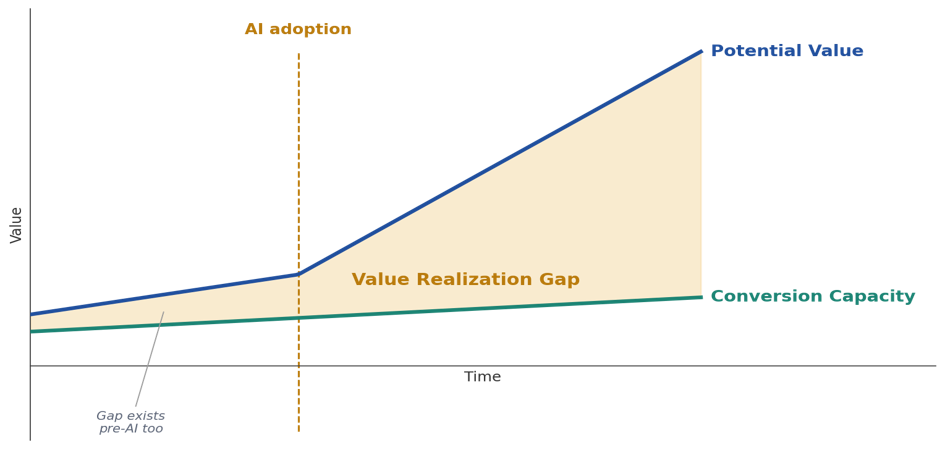
After AI adoption, Potential Value inflects sharply while Conversion Capacity, bounded by organizational gates, barely moves. Horizontal axis is time, vertical axis is value; schematic, not fitted to actual figures.
| Value Realization Gap = Potential Value × (1 − VRR) Grows with Potential even at constant VRR. This isn’t AI degrading organizational capability; it’s a fixed inefficiency sitting behind a much larger number. |
Boundary Conditions and Predictions
This theory works best for measurable value spread across many initiatives, built up gradually, where VRR is used to diagnose problems rather than as a target to hit. It needs adapting for value that’s hard to measure (trust, culture), single make-or-break bets with no portfolio to average across, and all-or-nothing payoffs like network effects or regulatory approval, where getting 80% of the way there can still mean realizing zero value. One more caution: if an organization’s conversion rates look unusually well-correlated, that can also just mean it only greenlit the easy, safe bets, not that F.A.C.T is genuinely working.
Four hypotheses make the theory falsifiable rather than just descriptive:
H1. Controlling for Potential Value, organizations with higher VRR realize more economic value the following period than organizations with lower VRR.
H2. Organizations whose FACT interventions raise conversion rates together, producing more balanced AR, CR, CoR, and RY within an opportunity, realize more portfolio value than organizations with the same average rates but less balance across them.
H3. Interventions targeting an organization’s weakest conversion stage produce larger VRR gains than equal-effort interventions on its strongest stage, net of spillover onto adjacent stages.
H4. Following AI-driven idea-generation adoption, Potential Value growth will substantially outpace growth in AR, CR, CoR, or RY, and the size of that gap will track how many gates a stage requires, not how much AI investment targets it.
---------------------------------------------------------------------------------------------------------------------
Putting The Theory To Work
The Chain, VRR, FACT, and the Potential Value Shock are the theory itself. What follows is a companion tool for applying it: useful for classifying where value sits, but not a fifth pillar alongside the four above.
The Value Balance Framework
All value an organization creates falls into one of four categories. Knowing which one an opportunity sits in determines what to do with it next.
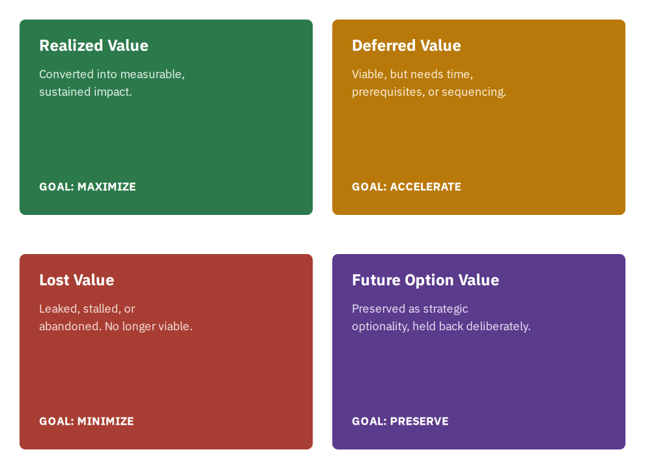
Deferred means intend to pursue once conditions improve. Future Option means held back deliberately to preserve flexibility. These are four discrete categories, not a two-axis continuum: an opportunity sits in one box, not somewhere between them. Opportunities still in motion through the Chain (Committed or Activated, outcome not yet known) aren’t classified until they resolve into one of these four.
A Worked Example
Applied to a small, illustrative pipeline of named AI initiatives, constructed to demonstrate the mechanism, not measured from a real portfolio:
| Initiative | Potential | AR | CR | CoR | RY | VRR | Expected Value |
| AI Copilot for Sales | 100 | 70% | 60% | 50% | 60% | 12.6% | 12.6 |
| Intelligent Document Processing | 80 | 80% | 70% | 60% | 65% | 21.8% | 17.4 |
| Customer Churn Model | 60 | 60% | 50% | 50% | 50% | 7.5% | 4.5 |
| AI Knowledge Assistant | 50 | 70% | 60% | 60% | 60% | 15.1% | 7.6 |
| Pipeline Total / Weighted Avg. | 290 | — | — | — | — | 14.5% | 42.1 |
Only 14.5% of this pipeline’s potential is expected to become realized value. That’s the weighted average of each item’s own VRR, tracked over time as the number that should move. Each row’s Expected Value is E[VRR] × Potential for that initiative, not a committed outcome. AR, CR, CoR, and RY here are estimated probabilities for an initiative that hasn’t yet cleared every gate, so the 12.6, 17.4, and so on are forecasts to be tracked against, not results already realized.
This pipeline is constructed to show the mechanism, not measured from a live portfolio. The next test for the theory is the same math run on real initiative-level AR/CR/CoR/RY estimates, to see whether the coherence effect below holds at the dispersion levels organizations actually show, not just the illustrative ones used here.
Why Conversion Coherence Matters
Take the same kind of AI pipeline as the example above. Two such portfolios with the same average conversion rate per factor can realize meaningfully different value, purely based on how balanced each item’s four rates are around that average. By the AM–GM inequality, a fixed average is maximized when the four rates are equal and falls as they spread apart. An item at 50%/50%/50%/50% realizes 6.25% VRR, but the same 50% average spread across 80/60/40/20 realizes only 3.84%, a third less, from the identical average rate. That gap is arithmetic, not organizational. It holds for any four numbers with a 50% mean, regardless of what they measure. What makes it organizationally interesting is the separate, testable claim that F.A.C.T interventions push a portfolio’s rates toward exactly this kind of balance rather than lifting one stage in isolation. H2 asks whether that holds empirically.
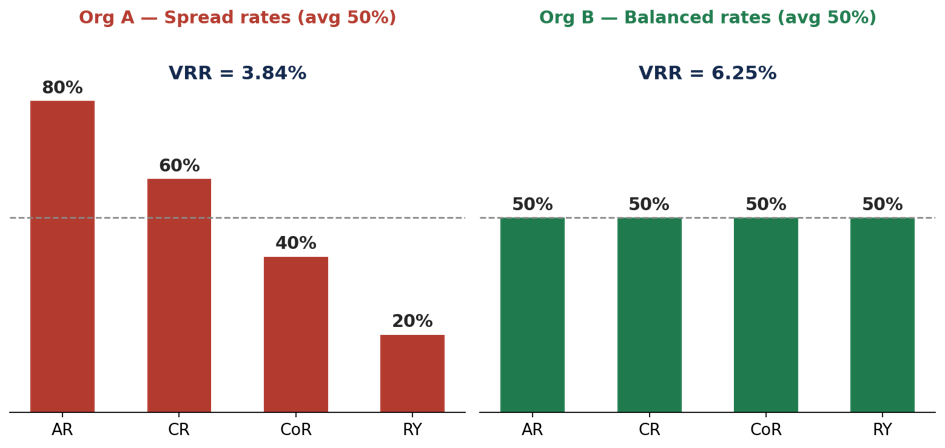
Same 50% average conversion rate per stage in both organizations. Org B’s four rates are balanced, Org A’s are spread. Balance alone makes Org B’s VRR 63% higher (6.25% vs. 3.84%), and the average never changes.
The Management Loop
Applying the theory is a repeating cycle: diagnose where value is dropping (Chain and VRR), classify what happened (Value Balance), prioritize the biggest leaks, act by applying F.A.C.T to the weakest rate, then measure and repeat. Compounding improvement is what turns a single fix into sustained realized value. It also has to keep running. As long as AI keeps replenishing Potential faster than any one fix can absorb it, a single pass around this loop closes the gap for a moment, not for good.
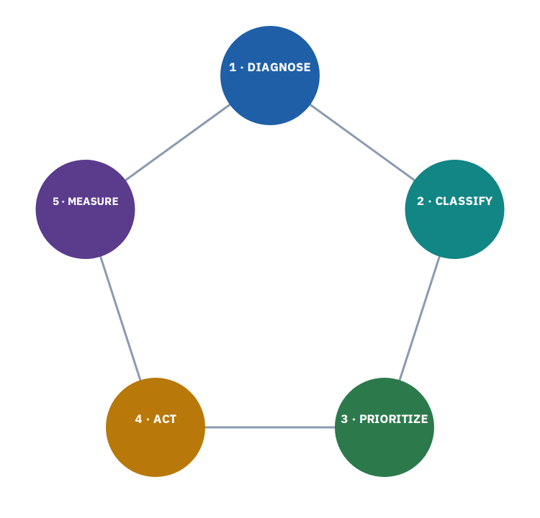
A continuous system, not a point-in-time audit. Runs clockwise from Diagnose back around to Diagnose.
The organizations that win will be those that convert the most of what AI makes possible into what truly matters.